Most Earthquakes Unpredictable
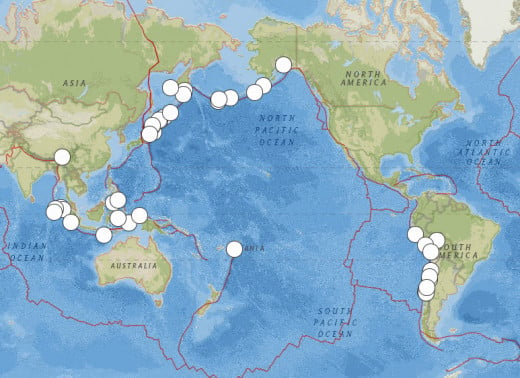
In this hub, great earthquakes will be featured (especially those of 8.2 magnitude or greater). In the 99 years from 1905 through 2003, there were 77 earthquakes of 8.0 magnitude or larger and for the 10 years from 2004 through 2013, there were 16 of them (above numbers per the recent ISC-GEM catalogue and the USGS). In other words, these rarer, more powerful events, were occurring once every 15 months on average until the past ten years, after which they became twice as frequent, or occurring once every 7.5 months. In the year 2007, they even occurred as frequently as once every 3 months (again, this is based on averages).
However, sometimes these giant temblors are spaced within less than 2.5 days. In the 160 years from 1854 through 2013, there have been four pairs of these types of events. Two of those four occurred 150 years apart, to the day. Here's how they breakdown:
1854,12/23 0000UT 8.4 34N00 137E54 Enshunada Sea, Japan (3000)
1854,12/24 0645UT 8.4 33N06 135E00 Nankaido, Japan (3000+)
1906,08/17 0010UT 8.4 51N51 178E11 Rat Islands, Alaska
1906,08/17 0040UT 8.2 33S00 72W00 south central Chile (3760+)
2004,12/23 1459UT 8.1 49S20 161E25 N.or Macquarie Islands
2004,12/26 0059UT 9.1 3N18 95E59 off W.coast of N.Sumatra (++)
2012,04/11 0839UT 8.6 2N20 93E04 off W.coast of N.Sumatra
2012,04/11 1043UT 8.2 0N48 92E28 ditto
All of these events have one thing in common. Besides all of them being over 8.0 in magnitude and in paired groups with only 2.5 days or less separating them, they also are all within windows as defined by my earthquake astro-values.
As described in an earlier hub, the largest earthquakes do this more often then those of smaller caliber. Recently, due to extensive analysis, I have decided that from this point onward, rather than trying to forecast the likelihood of all earthquakes of 6.5 magnitude or higher worldwide each month, I will be looking at only those of 6.8 magnitude or greater (more on this later).
I have also decided that I will not be limited to the windows being a set 33% of the month in time. Rather they will relate to the average of the astro-values for each month. This will be closer to 50%. Based on a collection of 40 earthquakes of 8.2 magnitude or better (evaluated later in this hub), the time occupied by my windows is 45.4% each month (on average).
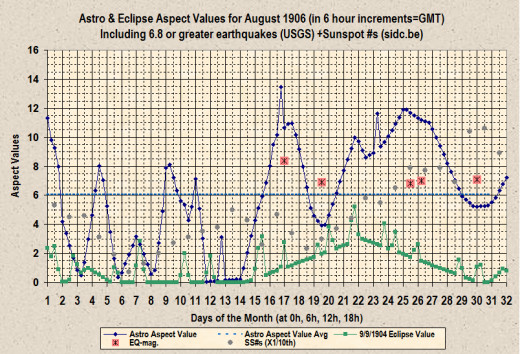
In the above illustration, the average astro aspect value equals 6.05 and the windows occupy 46.8% of the time during the month of Augusts 1906. On August 17 of that year there were two earthquakes above 8.1 magnitude (in Chile and Alaska) separated by 29 minutes (shown on the graph as just one event). Since there were 6 earthquakes of 6.8 magnitude or greater that month, three times more earthquakes than usual occurred at that time. There were 4 of these quakes inside the astro-value windows. Since 2.8 was the expected amount for a month with 6 earthquakes of at least 6.8 magnitude, then there were 1.42Xs more quakes within those windows than one would normally expect under those circumstances.
Since I won't be looking at earthquakes of 6.5 to 6.7 for predictions after this there will be only half as many earthquakes each month (on average) and thus less hits and misses. However, I am confident that the percentage of hits will go up (more on this towards the end of this hub). Here's a breakdown of the averages of different ranges of magnitude:
7.95 or greater for 1905-2003 = 0.8 per year
7.95 or greater for 2004-2013 = 1.6 per year (100% more)
7.25 to 7.94 for 1918-2003 = 5.06 per year
7.25 to 7.94 for 2004-2013 = 7.3 per year (44.3% more)
6.75 to 7.24 for 1918-2003 = 13.28 per year
6.75 to 7.24 for 2004-2013 = 15.8 per year (19% more)
6.45 to 6.74 for 1918-2003 = 18.57 per year
6.45 to 6.74 for 2004-2013 = 24 per year (29.2% more)
Data source for the above figures are the recent GEM-ISC catalog (1st line of each group) and the USGS/ANSS Comprehensive Catalog (2nd line of each group). Based on the above statistics, here are the monthly breakdowns:
7.95 or greater for 1905-2003 = 0.067 per month
7.95 or greater for 2004-2013 = 0.133 per month (100% more;
1 event every 7.5 months on average)
7.25 or greater for 1905-2003 & 1918-2003 = 0.49 per month
7.25 or greater for 2004-2013 = 0.74 per month (51% more;
3 events every 4 months on average)
6.75 or greater for 1905-2003 & 1918-2003 = 1.6 per month
6.75 or greater for 2004-2013 = 2.06 per month (28.75% more)
6.45 or greater for 1905-2003 & 2018-2003 = 3.2 per month
6.45 or greater for 2004-2013 = 4.1 per month (28.1% more;
1 event every 7.5 days on average)
7.25 to 7.94 for 1918-2003 = 0.42 per month
7.25 to 7.94 for 2004-2013 = 0.61 per month (45% more)
6.75 to 7.24 for 1918-2003 = 1.1066 per month
6.75 to 7.24 for 2004-2013 = 1.32 per month (19.3% more)
6.45 to 6.74 for 1918-2003 = 1.55 per month
6.45 to 6.74 for 2004-2013 = 2.00 per month (29% more)
Breakdown of 6.45 magnitude or greater earthquakes that occurred inside or outside of the windows defined by astro-values (period is from 5/1/13 through 4/30/14):
.........................................................Inside........Outside
8.15 magnitude and greater..................2................0......100%
7.25 to 8.14 magnitude..........................7................1........88%
6.75 to 7.24 magnitude........................10................4........71%
6.45 to 6.74 magnitude........................13..............15........46%
6.45 magnitude and greater................32..............20........62%
6.75 magnitude and greater................19................5........79%
7.25 magnitude and greater..................9................1........90%
As one can see from the breakdown above, as the magnitudes get smaller, so also do the percentages of quakes that are inside the windows. Even though most of the period here studied had greater seismic activity than usual (which tends to favor astrological correlations), the performance in the 6.45-6.74 category was enough to make me want to raise the bar from this point onwards to 6.75 magnitude or higher when considering forecasts for “significant” earthquakes.
Actually, although the 6.75-7.24 magnitude range of earthquakes showed a strong correlation with astro aspect value windows in 2013 (not nearly as much in 2014 so far), it appears to yield only average results when looking at less active periods of time. As a result, although this range is now the lowest included for significant earthquake forecasts, it may be cast aside in favor of the bar being at 7.25 as the lowest during periods of slow activity (which may be on the horizon and last a few years).
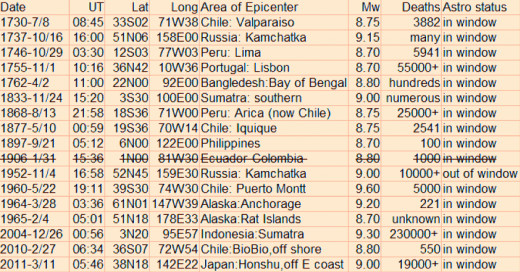
To get a better idea of how my forecast algorithm was working for a more comprehensive period of time, and to first zoom in on the largest earthquakes (because they have the highest correlation to my astrological based aspects), I collected seismic events that had recently been evaluated for magnitudes that ranged from 8.7 Mw or higher. For this category, there are only eight such quakes for the 20th and 21st centuries. As a result, I went further back in time and located nine more in this category going as far back as the year 1730. Of these, one earthquake that occurred on January 31, 1906 was removed due to it having the most uncertain magnitude determination of perhaps all of the earthquakes that I have ever encountered (8.35 Mw give or take 1.18 Mw). Total earthquakes in this category: 16
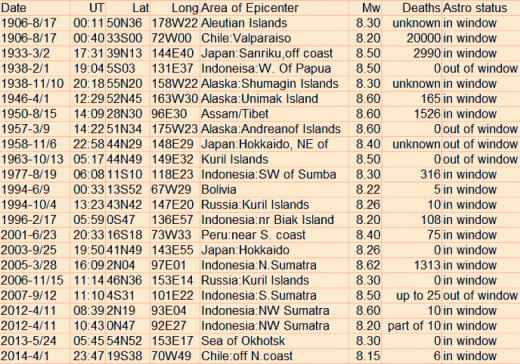
Following that size category I collected earthquakes of 8.15 to 8.6 magnitude or greater. One criteria for their selection was that they also needed to not have the lowest possible end of their magnitude estimates go below 8.1 (so that an 8.3 Mw quake, give or take 0.2 Mw would be acceptable, but an 8.2 Mw one with a range of plus or minus 0.2 would not). For that category I used only events from the 20th and 21st centuries. Total earthquake in this category: 23
After this range of earthquakes I gathered events of 7.25-8.04 Mw for the period from August 2010 through the end of 2013 (a time frame that represented a much greater frequency of significant earthquakes than usual). Total earthquake in this category: 28
Finally, I looked at earthquakes in the 6.75-7.24 Mw range, also from the period of August 2010 through the end of 2013. Total earthquakes in this category: 52
As would be expected (if there is more randomness associated with the more numerous smaller caliber quakes), the results went from exceptional at the top of the ladder, acceptable in the middle, and no astrological correlation at the bottom. The breakdown is below and the spreadsheets of the earthquakes used in the 8.05-8.64 and 8.65 and higher ranges are above.
….......................................Inside...Outside.....................................
….....8.65 Mw and greater.......15.......1......(94%)...2.03Xs expected
….....8.15-8.64 Mw...................18.......5......(78%)..1.72Xs expected
….....7.25-8.14 Mw...................21.......7......(75%)..1.65Xs expected
….....6.75-7.24 Mw...................26......26.....(50%)...1.1Xs expected
Notes: If one looks at the 6.75-7.24 Mw category for the more active period defined by the year 2013, the results are much better (7 quakes inside the windows to 2 quakes outside or 1.7Xs the expected value). The expected values are derived from taking the total number of quakes in the category and multiplying by 0.454 (45.4% was the average amount of monthly time that my astro-value windows occupied for the upper two categories).
© 2014 Joseph Ritrovato


